The Oil Drum… post goes into the global consumption of energy and provides a dataset in Excel for researchers on global primary energy consumption from 1830 to 2010. In other words, the energy contained in fossil fuels, uranium, and biomass in their raw form before processing into electricity, heat, or liquid fuel, and direct electricity production from hydro, solar, wind, and geothermal. The dataset, based on an assessment of seven different data sources, shows the following:

  • We are now burning 10 times as much energy as a century ago to provide the goods and services we consume.
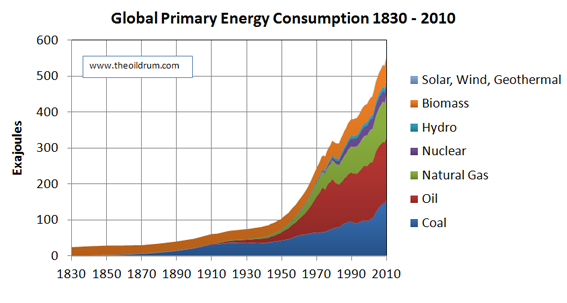
  • Energy consumption is still increasing rapidly, with an approximate 550 exajoules (523 Quadrillion BTUs) consumed at the primary energy level in 2010.
  • Of this total 80% was provided by fossil fuels, 11.3% by bio-energy mainly from wood combustion, 5.5% from nuclear, 2.2% from hydro, and 0.4% from other renewable energy sources.
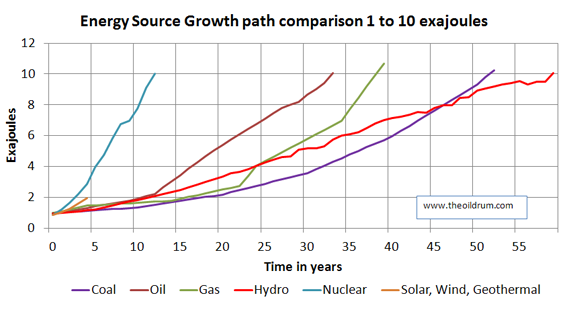
  • The historic time for each energy source to grow from 1 to 10 exajoules in primary energy production was 12 years for nuclear, 33 years for crude oil, 39 years for natural gas, 52 years for coal, and 59 years for hydro-power.

A graphical depiction of the data and comparison of sources can be found below the fold.

The charts below can be found in the Excel file, source attribution can be found at the bottom. The data in the charts is normally displayed in exajoules (10^18 joules) and in a few cases in Quadrillion (10^15) BTU’s for data comparison. The following conversion factors were used:

  • 1 joule = 9.48×10⁻⁴ BTU.
  • 1 boe (barrel of oil equivalent) = 5.45 x 10⁶ BTU.
  • 1 cubic feet of natural gas = 983 BTU.
  • 1 metric ton of coal = 22.72 * 106 BTU.
  • 1 exajoule = 174 million barrels of oil equivalent.

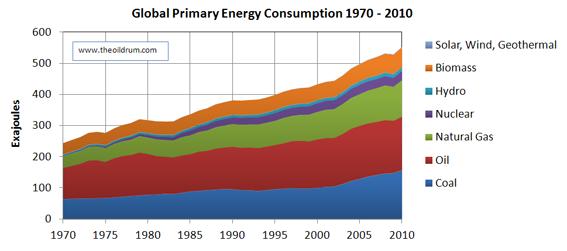
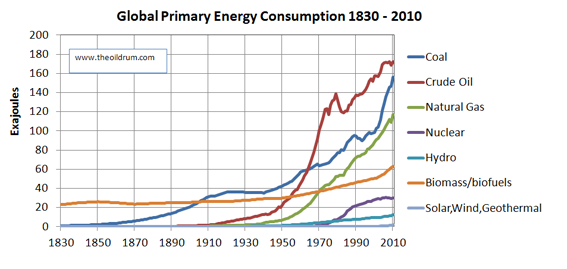
Global Primary Energy Consumption per source stacked and individual graphs

The first two charts in this section display the evolution of primary energy consumption broken down by energy sources. Figure 1 shows the evolution from 1830 to 2010 and Figure 2 from 1970 to 2010. The same is shown in Figures 3 and 4 but by the individual curves of each energy source.


Figure 1 – Stacked chart of Global Primary Energy Consumption 1830 – 2010


Figure 2 – Stacked chart of Global Primary Energy Consumption 1970 – 2010


Figure 3 – Individual curves for energy sources of Global Primary Energy Consumption 1830 – 2010


Figure 4 – Individual curves for energy sources of Global Primary Energy Consumption 1970 – 2010

Growth path comparison of Primary Energy delivered per source

In this section, a dataset is graphically depicted wherein a comparison is made of the number of years for each energy source to grow from 1 exajoule to 10 exajoules of energy production. By comparing these, it can be shown how long different energy sources took to become influential in global energy supply.


Figure 5 – Energy Source Growth Path comparison 1 to 10 exajoules

Comparison of different Primary Energy Data sources


Please continue reading at:

DISCLAIMER: Environmental, Health and Safety News is not affiliated with or maintained by ANY for profit or non-profit entity. It is a 100% volunteer effort free from advertising or sponsorship of any kind. This site is intended to be an educational and not-for-profit website providing useful information for security, environmental, health, sciences, transportation, and public safety professionals and the general public. It is not “for the purpose of trade, to induce the sale of any goods or services.”
In the Webmaster’s opinion, any incidental use of any pictures and graphics, or quoted words on this site is not a violation of any trademark for the any reasons stated above. The webmaster will fully cooperate with any and everyone that believes any section of the site are in violation of fair use.

The use of any and all copyrighted works in the creation of this site is, in the Webmaster’s opinion, protected by 17 USC 107 (see Creative Commons License below). If the owner of a copyrighted work used in the creation of this site believes that 17 USC 107 does not apply to the use of their work, the site’s creator will cooperate to the fullest extent possible.

FAIR USE NOTE: The site provides information of a general & public nature regarding national or other developments. None of the information contained herein is intended as legal advice or opinions relative to specific matters, facts, situations or issues. Additional facts, information or future developments may affect the subjects addressed in this site. You should consult with an expert about your particular circumstances before acting on any of this information because it may not be applicable to your situation. This site contains information and links to sites which are not owned or maintained by this site. This site is not responsible for the content, linked sites, and the views expressed on linked sites do not necessarily reflect our views or opinions. The information contained herein is provided for personal, non-commercial, educational, entertainment and informational purposes only and does not constitute a guarantee of information or facts. This site makes no claims, expressed, implied, or statutory regarding the accuracy, timeliness, completeness, or correctness of any material contained herein. Since the conditions of use are outside my control, the individual visitor is entirely responsible for determining the appropriateness and applicability of all information contained herein.

This website is licensed under a Creative Commons License.

Back to Top