Image by Hidewo Ishida
Approximately 80% of Japanese people think that continued GDP growth is necessary. That is one of the key findings of a survey on attitudes on the economy conducted by the Institute for Studies in Happiness, Economy and Society, a partner organization of JFS. The survey, conducted in October 2014, also identified a sense of anticipation that expanding GDP may improve employment and wages.
http://www.japanfs.org/en/news/archives/news_id035130.htmlBut the reality we see in statistics is contrary to our expectation. Let’s take a look at an article posted in the “Understanding Data” column of the e’s Inc. website to see how GDP relates to unemployment and poverty.
GDP and overall unemployment
Many of us believe that economic growth and subsequent GDP growth lead to more jobs, and therefore lower unemployment. That is why many think that economic growth is a priority even though they are well aware that it depletes global resources. But does GDP growth really help reduce unemployment? Here’s the graph showing how GDP and unemployment correlate.
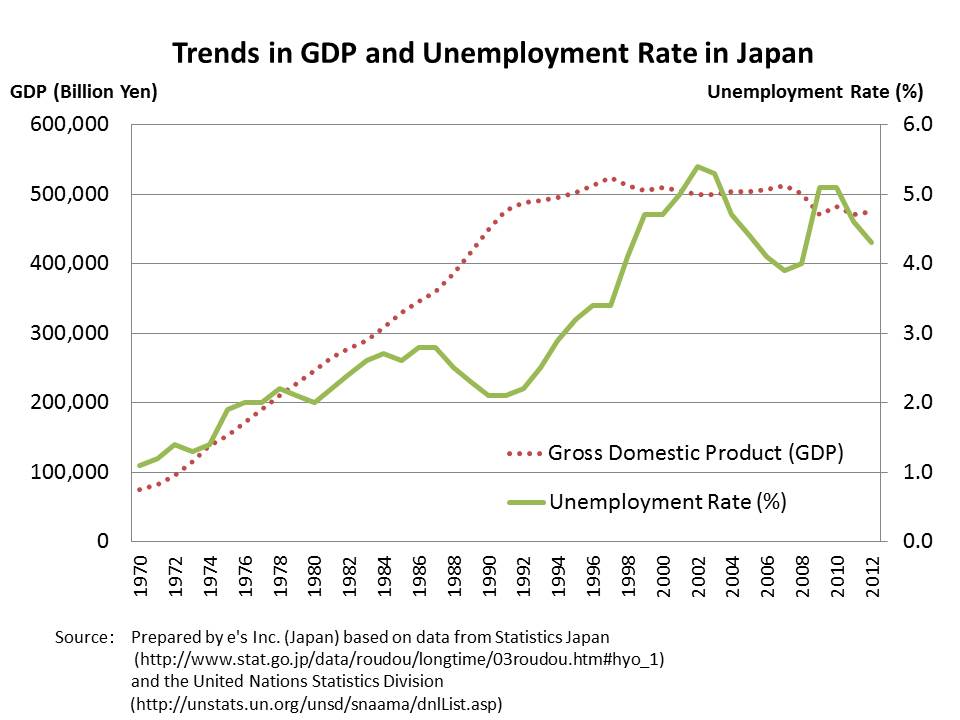
The red and green lines represent GDP (left axis) and unemployment rate (right axis), respectively. Unemployment rate means the percentage of people who are 15 or older and without a job, despite being employable and actively searching for a job.
Although GDP growth and declining unemployment were predominant trends from the late 1980s to early 1990s, other time periods exhibit varying relationships between the two. Overall, if you compare 1970 and 2012, you notice both GDP and the unemployment rate have gone up.
Thus, contrary to what the majority assume (or wish), a higher GDP has not helped to reduce unemployment. In fact, unemployment is worse today than at times when Japan’s GDP was lower.
GDP and Relative Poverty Rate
According to OECD Factbook 2010 (data taken from mid-2000s,) the Japanese relative poverty rate was the fourth highest among 30 then-member countries. This may be shocking data for those who have never thought poverty even exists in a rich nation like Japan.
The relative poverty rate is often used as an index when discussing poverty in industrialized nations. It takes the median income (the middle figure when all incomes are lined up from lowest to highest), and says that the percentage of the population living on less than half of the median income is living in a state of relative poverty. That percentage is the relative poverty rate of a particular nation.
Let’s now look at trends in Japan’s relative poverty rate and GDP in the graph below. As you can see, the relative poverty rate increased from 12% in 1985 to 16% in 2009, while GDP expanded from 1985 to 1991, and since then has stagnated.

How do the two correlate? The overall trend is that, if we compare figures from only the beginning and the end of the graph, both GDP and the relative poverty rate increased from 1985 to 2009. Looking closely, however, you will notice that the relative poverty rate went both up and down during GDP expansion, and there is also a brief period of time when both the poverty rate and GDP dropped.
All this proves is that the relative poverty rate and GDP relationship is a bit complicated. But at least it clearly dismisses our common belief that GDP growth reduces poverty.


Connect with EHS News